Introduction[ | ]
In this write up we will be sharing some valuable information that we have gathered as a result of research and map optimisations, which are mostly GPU focused. Information on how to profile and what commands are available can be found in UE4 documentation below:
- https://docs.unrealengine.com/en-US/Engine/Performance/GPU/index.html
- https://docs.unrealengine.com/en-US/Engine/Performance/StatCommands/index.html
- https://docs.unrealengine.com/en-US/Engine/Rendering/VisibilityCulling/index.html
Some extra reading if you’re interested. This contains some similar methods as well as great detailed information on performance and profiling:
A lot of leg work has already been done by the team in the last few months that automatically translates into your maps if you’re using OWI assets. This includes things like added and improved LODs to Static Meshes, changes at the engine/config level for rendering, new and updated foliage assets and more optimised Landscape Materials. The rest of the way comes down to how your maps are constructed!
Recommendations[ | ]
The following is a set of statistics that we’ve agreed upon internally after conducting research into the performance of our maps and how to approach optimisation. The first step is to profile the map and see what areas need to be improved but do keep in mind that every map will be a little different, especially if you’ve already done a considerable amount of work on it before getting to the optimisation stage. With these recommendations you should have a much more performance friendly map.
I would also like to point out that these recommendations aren’t to be taken literally - there will be cases where your map can perform well if your numbers are higher and it could perform worse if they are lower. The key is to profile and figure out just what the problem is!
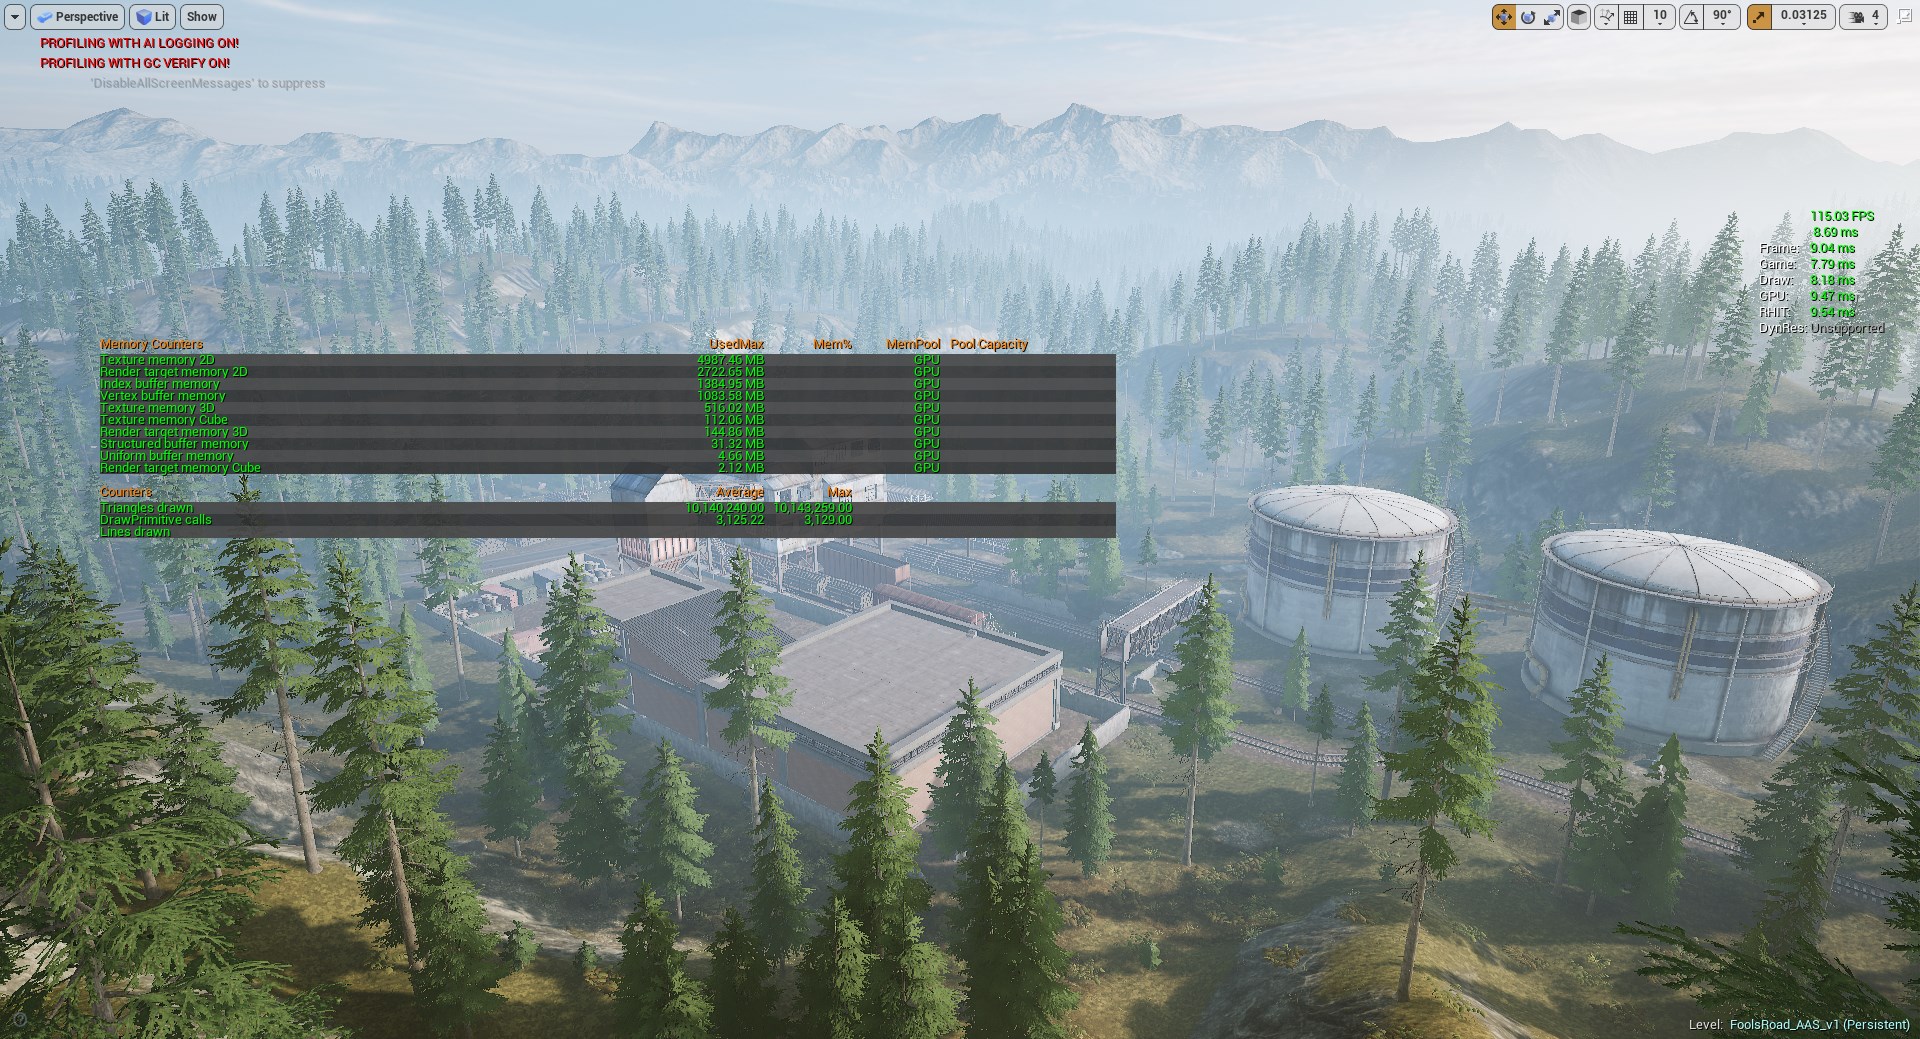
To start off, open your map and run the following commands to get a high level overview:
- stat fps
- stat unit
- stat rhi
Your editor viewport should now look similar to the image on the side with lots of useful information to get you started!
Editor viewport with several stat commands enabled for profiling.
Important Stats[ | ]
- Triangles: ~8,000,000
Go to stat rhi
- Draw Calls: ~4,500
Go to stat rhi
- Landscape Total Components: 256
Go to Landscape>Manage>Change Component Size
- Landscape Material Layers: 7
Go to Landscape>Paint
- Landscape Layer Density/Usage: 7
With the Landscape>Paint tab open, go to View Mode>Visualisers
- Ambient Occlusion Radius: 150
Post Process Volume/Lighting BP
Additional Tips[ | ]
- Keep the amount of Landscapes to 1 as they are expensive. If you need terrain that’s outside of the gameplay area to help convey scale then consider using background Static Meshes that we have on our maps too. You also have the option of using extra Landscape components or a larger heightmap (for example a 4k with a 2k playable area) but this is expensive and we don’t recommend it in the long run.
- If you have Landscape Components that are hidden by background Static Meshes then you should delete them to reduce your total Component count, which also reduces draw calls. If it can’t be seen then it can be removed!
- When painting your Landscape Material Layers try to keep in mind the intensity of your brush and where you paint. If you have slight strokes at 10% that don’t really contribute to the visual fidelity then it’s worth erasing it from that Landscape Component as it increases the Landscape Layer Density/Usage. We have seen several issues such as significant FPS drops (GPU timings spike) with Landscape Layer Density/Usage higher than 8 (avoid having pink Components with the Layer Density view mode).
- Landscape Splines can be further optimised by using longer/larger Static Meshes to reduce the amount of instances, which reduces the amount of draw calls. For example, using an 8m long Static Mesh instead of a 4m long one will half the amount of mesh instances used. This is something to keep in mind when starting a map and something to double check if you make the changes on a map that has existing Splines.
- Keep your Ambient Occlusion Radius between 50 and 150. Setting the radius too high has proven to take up to 2ms on my GPU as AO is something that scales and becomes more expensive at higher resolution. This can be the difference between 55 FPS and 60 FPS. Additionally, having a high radius introduces visual artefacts and can wash out your map compared to a lower radius. This can be found in the Post Process Volume or a Standard Lighting BP. Another Ambient Occlusion optimisation includes setting the quality to 50 instead of 100.
- Ensure you minimise Light Overlap if you are placing additional light sources in your map by either moving them, reducing their influence via the radius or reducing the amount of them placed together. Use the Light Complexity View Mode to check how complex your light sources are and to quickly identify overlapping light sources.
- Disabling Shadows on small scale foliage such as grass, flowers, crops (poppy, wheat etc) and small scatter rocks can help increase performance at little to no visual cost due to the harsh shadows they produce. You can disable Shadows in the Foliage tool (when painting using the Foliage tool) and the Landscape Grass Type assets (when using LGT for procedural placement).
- Overlapping Decals increase Quad Overdraw, which is something we want to keep to a minimum as it becomes expensive. You can avoid this by spreading Decals out and ensuring they don't overlap too many times if you're using a lot of them to detail an area. Check for Quad Overdraw and overlapping Decals by using the Quad Overdraw View Mode.
- If you are creating or placing any existing Particles such as smoke, fires and waterfalls make sure they are optimised by checking Shader Complexity and Quad Overdraw. In order to optimise these you could reduce the amount of emitters and the scaling or switching to a simpler method when it comes to the Shader.
Profiling Maps[ | ]
There’s a few things to know when it comes to profiling maps including personal performance, how to set up your maps and what tools to use. The most important thing to keep in mind is that every system is different and it takes some time and experience to understand how your own map performs with your system.
For example, my system runs at 3840x2160 (4k) resolution and is made up of an Intel i7-6700k @ 4.5GHz, Asus ROG Strix GTX 1080 and 16GB RAM @ 3000MHz. Through research and experimentation I have figured out that my personal target for a more significantly optimised map with max settings is 60 FPS (which clocks in at ~16ms on my GPU timings). A small improvement in GPU timings on my system has also shown to be a large one on another developer’s system which was running an older generation GPU.
Consistent Data[ | ]
When profiling it’s important to keep the environment consistent. In order to achieve this I set up several Camera actors throughout the map and use the “Snap View to Object” option when you right click them. I like to have a good mix of player level angles at various points of interest that get a lot of gameplay time and a couple helicopter/admin cam level overviews. You can then use these Camera actors to gather screenshots with your stats for comparisons if you wish.
You can fly around your map in the editor viewport and when you finally find an angle you like you can click the little arrow dropdown in the top left of the viewport and select “Create Camera Here”. Then you can cycle through your various Camera actors by either using “Snap View to Object”. It’s also possible to use the Perspective dropdown in the top left and go through the Placed Cameras list there but this throws you into a Pilot mode, which I don’t recommend using. Once your editor viewport has snapped to the Camera you can enter fullscreen, enable Game Mode (it’s important to get rid of any selections and additional overlays like splines, actor billboards, volumes etc as these add to performance) and start gathering your data!
Useful Commands, Tools and View Modes[ | ]
- https://docs.unrealengine.com/en-US/Engine/Performance/StatCommands/index.html
- https://docs.unrealengine.com/en-US/Engine/Performance/GPU/index.html
- https://docs.unrealengine.com/en-US/Engine/Rendering/VisibilityCulling/index.html
Commands[ | ]
- stat fps
- stat unit
- stat rhi
- stat gpu
- stat scenerendering
- freezerendering
Tools[ | ]
- Statistics
Window>Statistics This tool is great for finding extremely expensive assets as well as general info.
- GPU Visualiser
Console Command>profilegpu This tool is great for seeing what takes how much time on the GPU.
View Modes[ | ]
- Shader Complexity
View Mode>Optimisation Viewmodes
- Quad Overdraw
View Mode>Optimisation Viewmodes
- Light Complexity
View Mode>Optimisation Viewmodes
- Mesh LODs
View Mode>Level of Detail Colouration
- Layer Density
View Mode>Visualisers
- Layer Usage
Enter Landscape>Paint, then go to View Mode>Visualisers
- Landscape LODs
View Mode>Visualisers